When clock speed becomes a design variable, context graphs evolve into Enterprise State Machines, and the enterprise becomes a continuously synchronized, continuously rep
What happens when you compress a company's decision latency by 100×, from weeks to minutes, or even seconds?
You don't just move faster. You change what the company is capable of. The enterprise stops reporting on reality and starts continuously recomputing its future.
Foundation Capital recently argued that context graphs represent AI's trillion-dollar opportunity. The premise is sound: systems of record captured what happened, but the next generation of platforms must capture why decisions were made so that intelligence becomes actionable.
There is, however, an implied prerequisite in that thesis that deserves to be made explicit. You cannot capture decision context at scale without first solving for time—specifically, how decisions propagate across thousands of people, workflows, and systems operating at radically different speeds.
VCs are debating how to build context graphs. Industrial enterprises have already been running them in production. The difference is that they started with a harder problem: not just capturing context, but synchronizing it. Without synchronization, you capture decisions in isolation, each function operating on its own clock, unaware of dependencies upstream or downstream. The result: decisions pile up as conflicting signals, and by the time they're reconciled, reality has moved on.
Every large enterprise operates on a mesh of overlapping clocks, most of which are invisible.
Sales and Operations Planning runs bi-weekly. Procurement operates daily. Factories run on two- to four-minute takt times. Machines, suppliers, and logistics partners generate continuous streams of events.
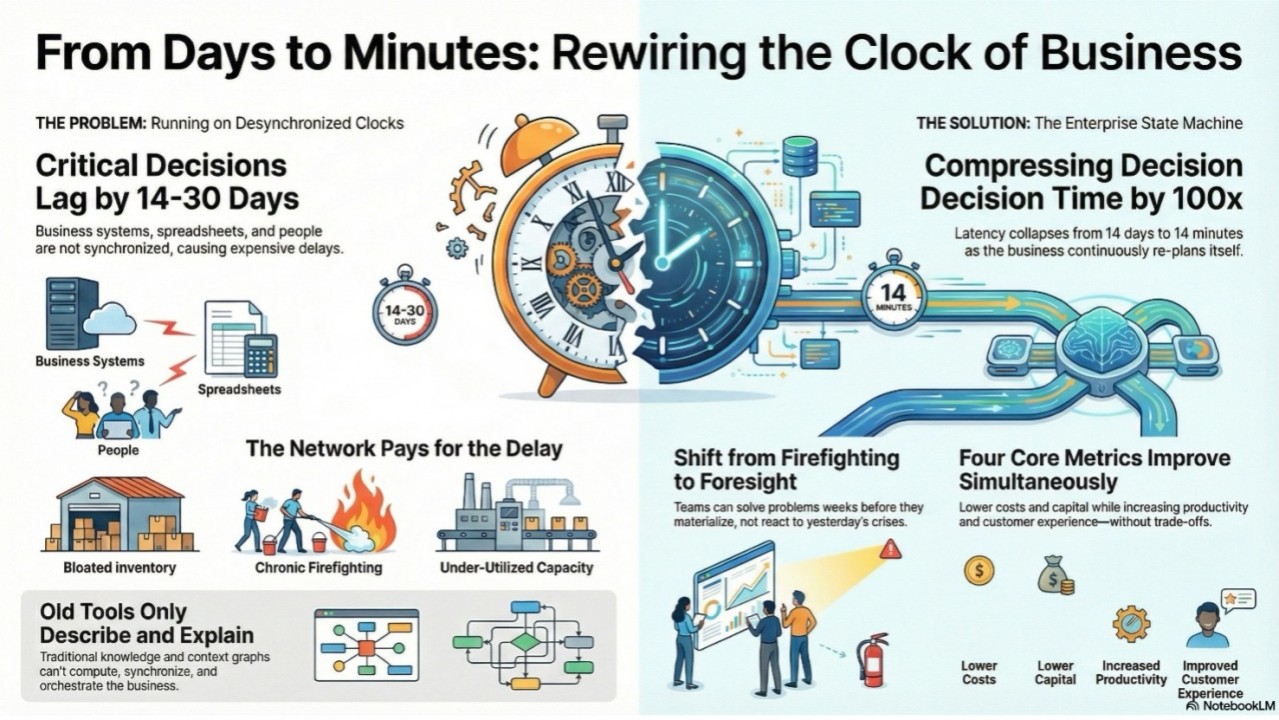
Yet the decisions that move cash and capital, what to make, buy, ship, or commit to customers, often propagate on a fourteen- to thirty-day lag.
That lag is not merely operational friction. It is the time constant of the business. It determines how much "just-in-case" inventory the enterprise carries, how often it pays for expediting and premium freight, and how long capital sits idle while teams reconcile conflicting views of reality.
Most enterprises have spent decades optimizing the state clock—systems that tell us what is true right now. ERP systems, CRMs, and planning platforms all excel here. The event clock—what changed, why it changed, and how fast that change propagated—largely does not exist as a first-class system.
We optimized state. We ignored the physics of change, the rules governing how decisions propagate, compound, and constrain each other across time.
When you compress decision-to-action latency from weeks to minutes, you don't get incremental improvement. You rewrite the economics of the firm.
Working capital shrinks because buffers are no longer a tax paid to protect against your own lag. Inventory tracks closer to real demand because orders, allocations, and schedules adjust continuously instead of waiting for the next planning cycle.
Operating costs fall as firefighting, expediting, and rework give way to coordinated execution. Instead of correcting last month's plan, teams execute today's best plan against a shared, live state.
Throughput and productivity rise because thousands of micro-decisions—which line to run, which shipment to prioritize, which supplier to lean on—are aligned in real time to the strategy and context of the business rather than negotiated over weeks.
Clock speed is not a KPI. It is the underlying physics of enterprise performance. Change the time constant and the behavior of the entire system changes with it.
At a Fortune 500 heavy equipment manufacturer, decision latency was compressed from seven days to one hour. Visibility extended from two days to sixteen weeks. The measurable outcome was over $250 million across working capital, operating cost, productivity, and throughput. Not because analytics improved, but because the operating clock was rewired.
The industry's move from knowledge graphs to context graphs is directionally correct.
Knowledge graphs model entities and relationships so machines can understand structure. Context graphs go further by assembling the relevant slice of data, constraints, and history needed to make a decision in the moment.
But most context-graph implementations hit the same limits:
They treat the enterprise as operating on a single timescale rather than as a network of functions with different cadences.
They optimize for better answers to questions rather than synchronized cross-functional action.
And they sit on top of the business as an analytical layer instead of being embedded as the live state of operations.
In short, they describe and explain well, but they do not continuously compute, synchronize, and orchestrate.
Context without time remains descriptive.
A real industrial enterprise is not just a graph of entities. It is a multi-dimensional state machine.
State changes every time a planner moves a date, a buyer shifts a purchase order, a line goes down, a supplier misses a window, or a customer pulls in demand. Capturing that reality requires infrastructure designed not just to observe decisions, but to run them.
An Enterprise State Machine has three defining elements:
First, a living topology. Plants, lines, suppliers, SKUs, lanes, contracts, constraints, and policies are modeled as a live graph, not a static catalog.
Second, an embedded computational graph. The operating model—how supply, demand, capacity, lead times, and financials propagate through that topology—is explicitly encoded so the system can compute impact, not merely display relationships.
Third, a time fabric across clocks. Factory takt times measured in minutes, daily procurement cycles, bi-weekly planning, and continuous sensor and event streams are synchronized into a coherent temporal model.
The result is that context stops being a view and becomes the state the enterprise actually runs on.
When procurement changes a schedule mid-afternoon, the impact on production, logistics, and revenue slots is recomputed within minutes, not at the next weekly meeting. When a line goes down, constrained supply, backorders, and financial exposure are recalculated across the network and routed to the right roles immediately.
This is not a better dashboard. It is a business that continuously replans itself.
In a multi-billion-dollar enterprise, there is no single decision-maker. Plant managers, buyers, schedulers, finance controllers, logistics teams, and sales leaders all make local decisions that are globally coupled.
When each operates on a multi-week lag, the network pays in predictable ways: bloated inventory, chronic expediting, and lost revenue from inconsistent customer commitments.
When clocks are synchronized and the state machine drives context, three things change:
Latency collapses between one person's decision and everyone else's awareness.
Actions become globally consistent because options are evaluated at the network level.
Human energy shifts from reconciliation and firefighting to proactive scenario evaluation.
Performance dimensions that usually trade off—cost, capital, service, and throughput—begin to move together.
Most analytics tell you what happened last week. Even advanced planning systems struggle to connect live physical reality with forward-looking risk in a way that operators trust.
A context graph with embedded computation changes that. When the graph understands not just "what is connected to what" but "how changes propagate through time and capacity," it can:
Project supply, demand, and shortage risks 14-20 weeks out, grounded in actual constraints and lead times rather than purely statistical forecasts.
Surface emerging risks, opportunities, and bottlenecks early enough that the organization has real options—rerouting, reallocating, re-committing capital—rather than relying on heroic last-minute saves.
In practice, that means moving from firefighting crises from two days ago to solving problems three to four weeks before they materialize.
This is why the meaningful comparison isn't "our graph versus your graph."
Traditional planning and analytics platforms—Kinaxis, o9, SAP, and others—are designed to analyze and recommend. They tell you what happened and what might happen under scenarios. Knowledge and context graphs enrich that analysis layer with semantics and retrieval but largely remain in the world of insight and explanation.
An Enterprise State Machine is different in kind. It's synchronization infrastructure. Its purpose is to compress the time between signal, decision, and coordinated action by 100× across the entire network.
Supply chain is simply where this shows up first because delay there is brutally expensive. You don't get weeks to debate; you get hours to reroute, reallocate, and commit capital.
The market has finally found language - "context graphs" -for something industrial practitioners have quietly needed for years.
The next step is recognizing that the real breakthrough isn't just drawing richer graphs. It's rewiring the enterprise clock itself.
When clock speed becomes a design variable, context graphs evolve into Enterprise State Machines, and the enterprise becomes a continuously synchronized, continuously replanning organism.
That's the category we've been building: not analytics that observe the business, but infrastructure that runs it.
The companies that master this won't just be faster. They'll operate in a different regime entirely, one where foresight replaces firefighting, and coordination becomes the default state.
Test your own scenarios with TADA’s Clean TO! Build and see the impact in minutes.
Try TADA Clean TO! Build
Test your own scenarios with TADA’s RM Inventory Manager and see the impact in minutes.
Try RM Inventory Manager

Use TADA’s Tariff Manager to model costs, build agility, and protect margins.
Try the Tariff Manager
Test your own scenarios with TADA’s Tariff Manager and see the impact in minutes.
Try the Tariff Managerest your own scenarios with TADA’s RM Inventory! Manager and see the impact in minutes.
TRY RM Inventory! Manager
Seshadri Guha has 25+ years of experience across competitive strategy, digital transformation, organizational design, and technology architecture.He has led large-scale change initiatives for multinational enterpr ises while building and scaling high-growth ventures.Previously, he led the Advanced Computing Technologies Group at Automated Analysis Corporation and was a founding partner at CGN Global, serving Fortune 100 clients.He founded TADA in 2016 and holds an MS from Iowa State University and a BS from IIT Madras, with executive education from Kellogg and Krannert.Guha also serves in leadership roles with multiple nonprofit organizations and founded Passage to India.

.jpg)
.jpg)
.jpg)